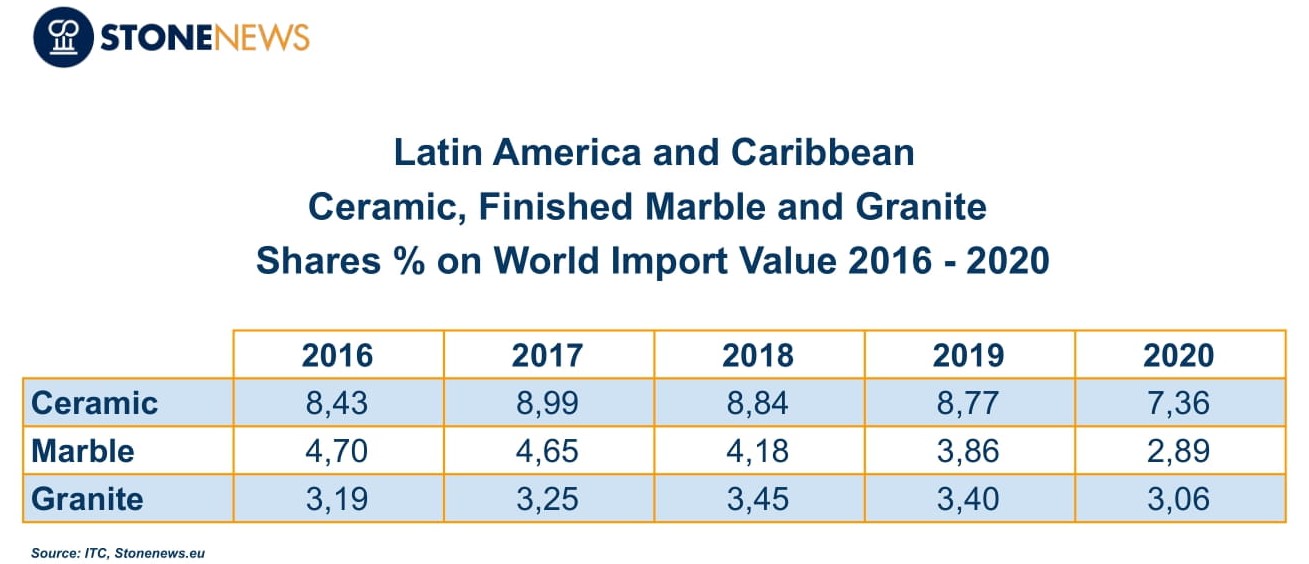
In the Chart below we see the shares (%) of Latin American and Caribbean countries on the global value of imports between 2016 – 2020:

In ceramic imports, there is a large dispersion in the shares (%) between the countries of Latin America and the Caribbean. However, the countries with the highest average shares in the value of imports are Mexico (14.7%), Chile (12.9%), Peru (8.76%), Colombia ( 8.67%) and the Dominican Republic (7.4%).
In the process of imports of finished marble, the average share of Mexico (40%) is by far the highest. They are followed by Brazil (9.96%), the Dominican Republic (8.83%), Panama (7.59%) and Argentina (6.7%).
The main suppliers of Latin American and Caribbean countries in ceramics are Brazil, China, India, Mexico and Spain. The main suppliers of finished marble products are Italy, China, Spain, Turkey, Greece. In the finished granite products are Brazil, China, India, Spain.
The COVID-19 pandemic negatively affected imports of ceramics, finished marble products and granite. Between 2019 – 2020, imports of finished marble products fell by -30.59%. Imports of ceramics fell -19.61% and of finished granites -18.39%.